This case study covers the following aspects:
1. Introduction of bridge type and details of the superstructure
2. Finite element modeling with constructions sequences
3. Checking results from structural analysis
4. Load rating and comparison in-house calculation and results from midas Civil
1. Introduction of bridge type and details of the superstructure
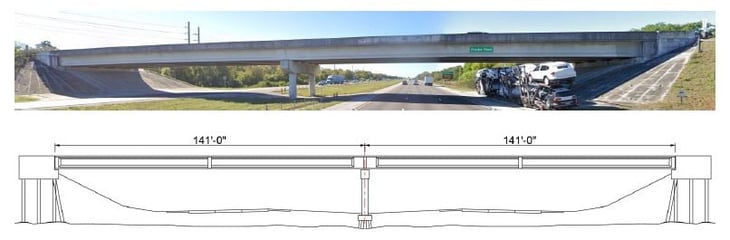
The type of bridge in this project is a continuous beam girder bridge which consists of 2 spans. The length of each span is 141 feet, and the total length of the bridge is approximately 280 feet.
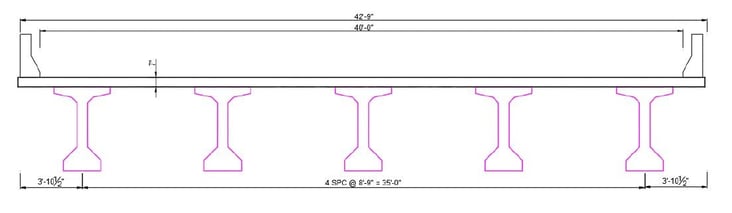
The superstructure consists of 5 prestressed precast concrete (PPC) beams and slab concrete. The width of the carriageway is 40 feet, and the total width of the slab is 42 feet. Girders are spaced equally along the width of the superstructure.
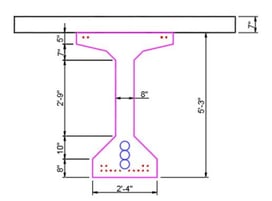
For the PPC beam, AASHTO Type V I-Beam was used. This girder has tendons for pre-tension and post-tension. Fourteen strands are placed at the bottom of the girder, and four strands are placed at the top of the girder. The pre-tension forces provide durability to the girder during the construction phase, such as transportation and erection of the girder and slab. After that, three tendons are installed along the longitudinal direction of the girder.
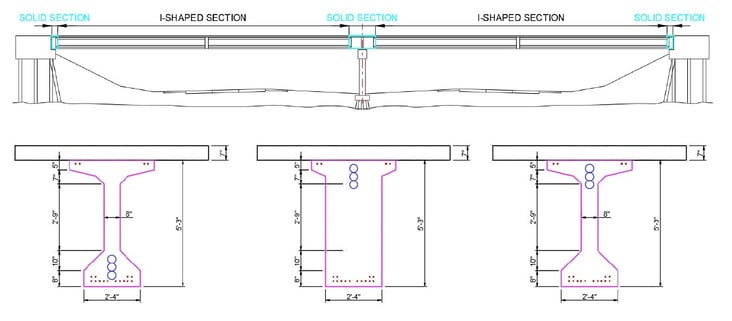
The precast beams are mainly I-shaped. Due to their continuity, solid sections are used for the supports and intermediate support. Notably, high negative moment occurs at the intermediate support because the continuous bridge is a statically indeterminate structure. Therefore, the rectangular section is used to resist high tension and compression forces.
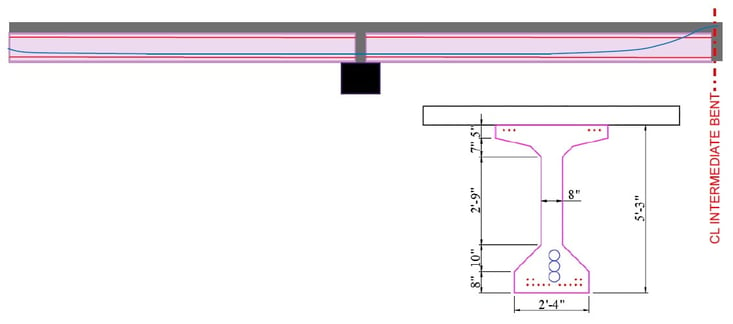
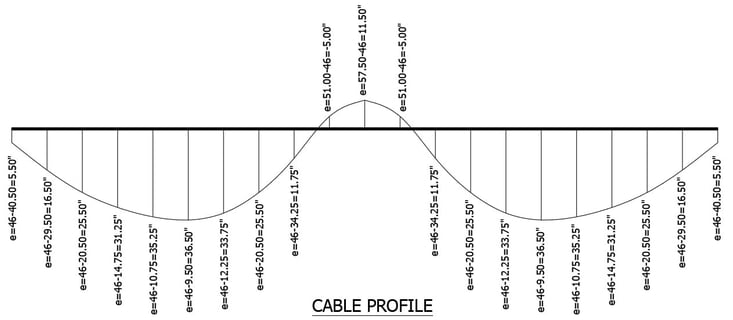
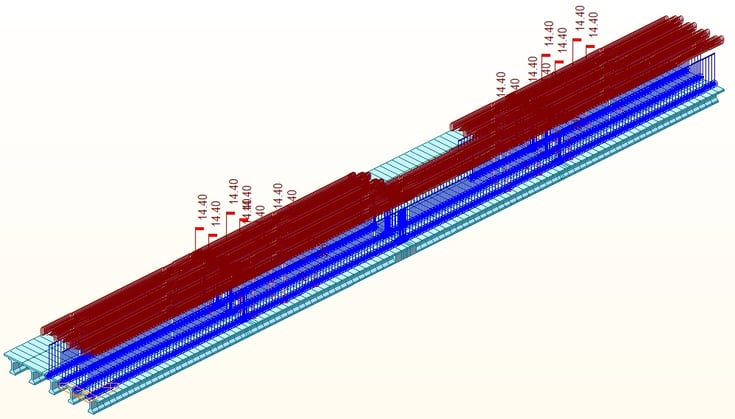
The PPC girder consists of 2 segments. Each segment is approximately 70 feet. In order to erect each segment, temporary supports were installed in the middle of the span during construction sequences. After the erection of segments, closures were poured, and the deck was erected using in-situ concrete. The blue line in Figure 5 represents the tendon profile for the post-tension. The tendon profile was planned against the bending moment due to dead loads, live loads, and additional dead loads.
2. Finite element modeling with constructions sequences
A. Stage no.1
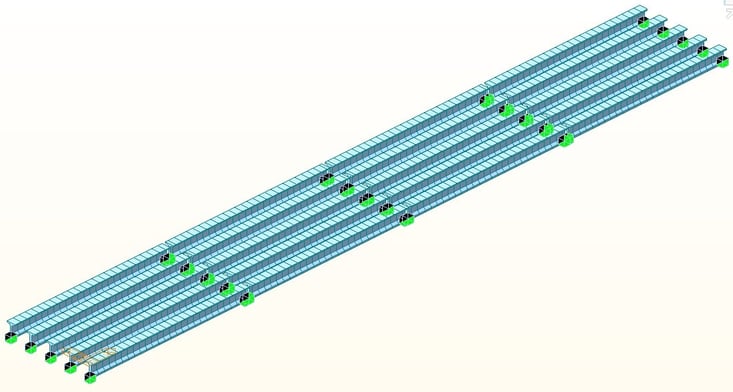
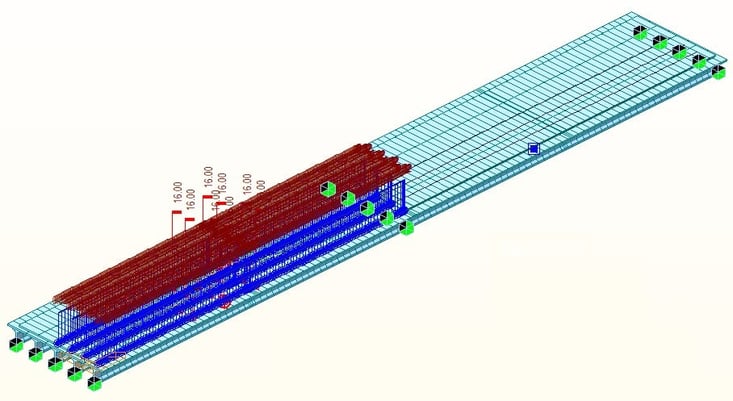
Now, we will discuss the construction sequences of the bridge. For the first stage, full segments of the girder are activated. Each segment is simply supported. The boundary condition has supports at both abutments and the pier. Furthermore, additional supports are activated to consider temporary supports for each segment of the girder. At the same stage, the self-weight of each segment and the prestressing force for the pretension are applied.
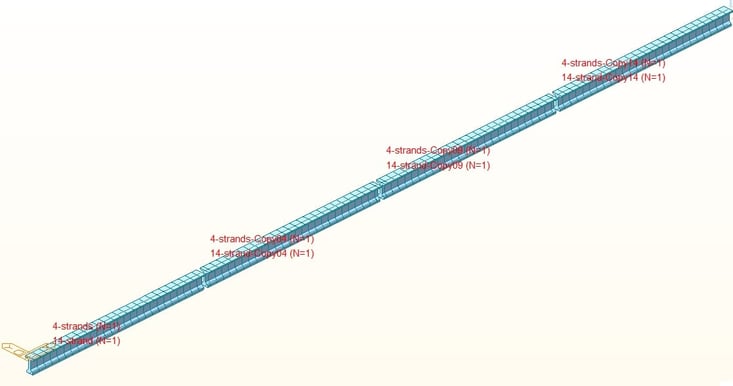
The prestressing force was applied considering the actual location of the strands.
B. Stage no.2
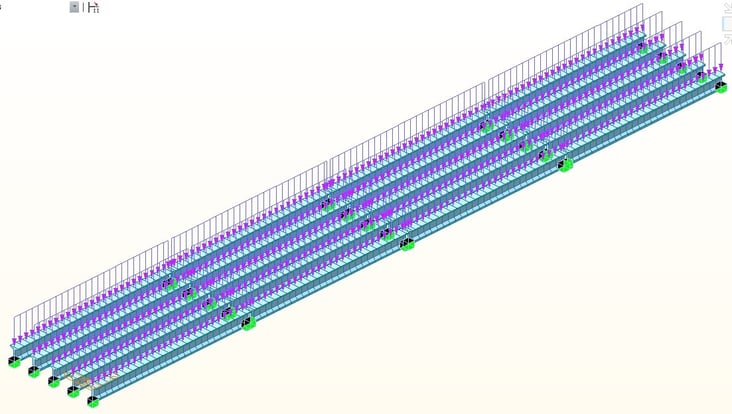
At stage no.2, additional beam loads are applied to consider the formwork of the concrete slab and the weight of wet concrete at each segment. Moreover, the weight of closures between two segments is applied to temporary supports.
C. Stage no.3
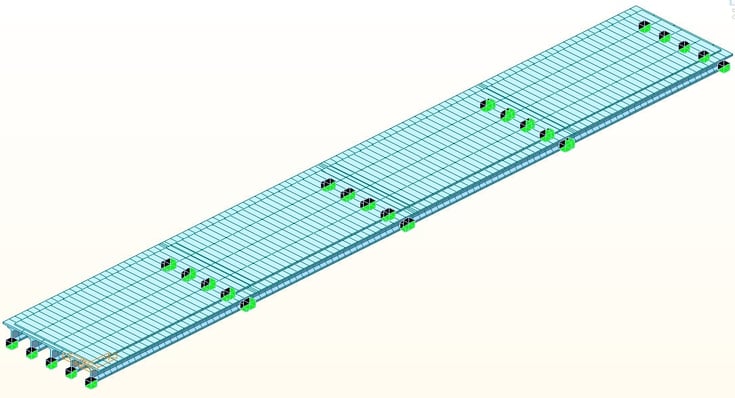
After concrete hardening, the beam and slab will act as a composite structure. In order to consider the composite section, midas Civil provides a composite section property and an option to control the section shape of elements. However, since the closures are still hardening, temporary supports are still activated.
D. Stage no.4
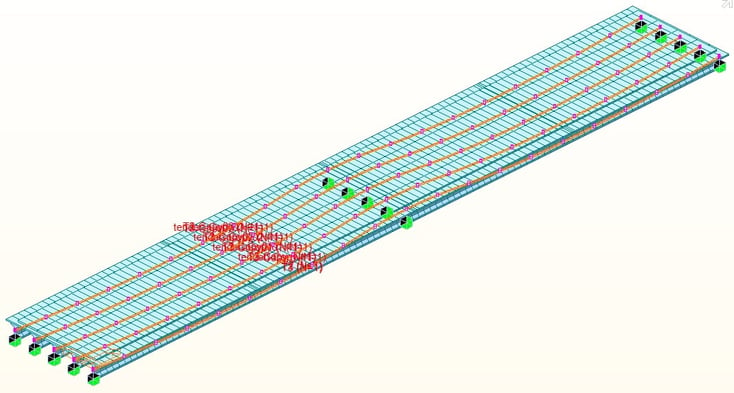
At stage no.4, temporary supports are removed, and tendon profiles for the post-tension are activated. Both anchorages at the end of the tendon profile are expected to be moved to reduce the friction loss. The total losses of post-tension are calculated following "Refined estimates of time-dependent losses (AASHTO 5.9.3.4)", which suggests that the total amount of losses is approximately 22% of the total post-tensioning force.
E. Stage no.5
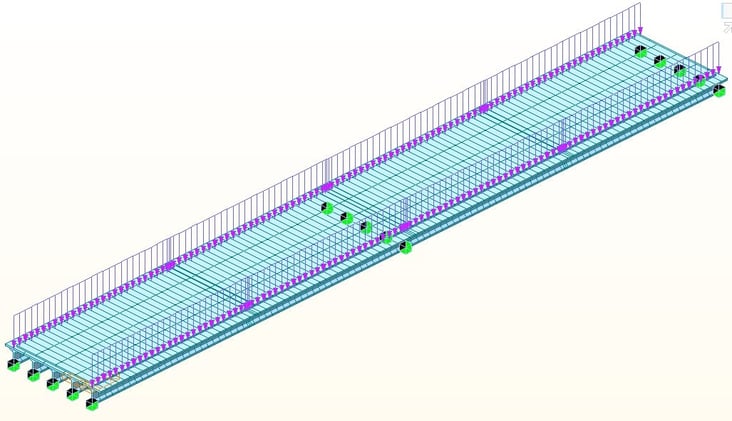
At the last stage, additional beam loads are applied to consider barriers.
F. Post-Stage
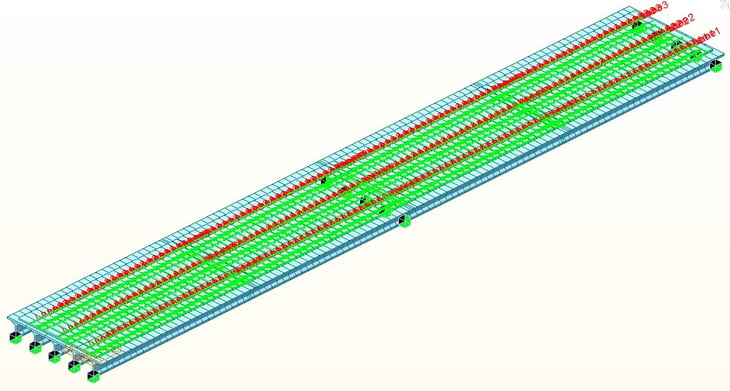
At the post-construction stage, vehicular live loads are applied to the continuous structure. Midas Civil provides moving load functions that are capable of applying traffic lanes and vehicles according to the design code.
3. Checking results from structural analysis
A. Stage no.1
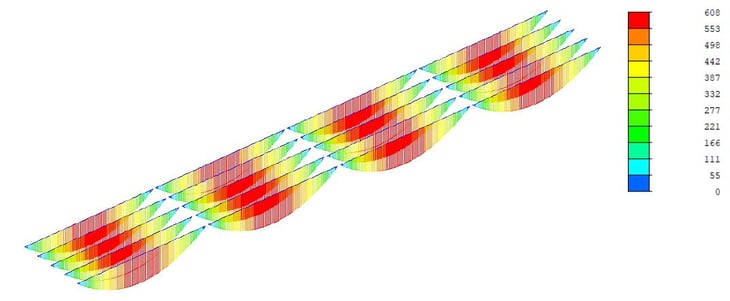
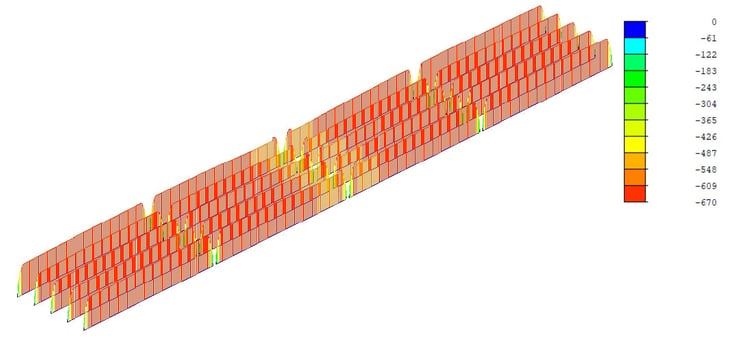
From stage no.1, we are able to obtain results from the self-weight of the structure and pretension forces. As shown in the following figures, all segment results are represented as simply supported beams.
B. Stage no.2 & 3
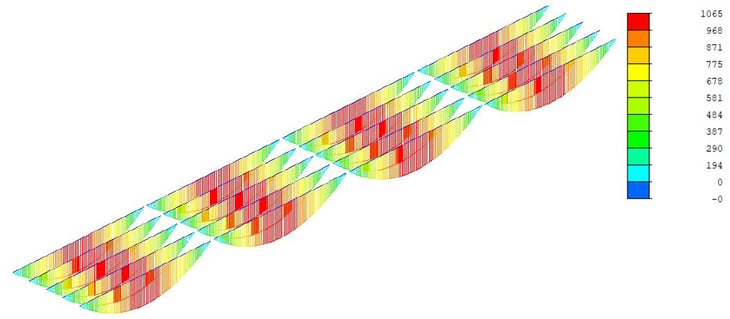
From stage no.2, we can get similar bending moment diagrams. However, the bending moment increases due to the self-weight of the concrete deck. Furthermore, stage no.3 shows the same results because this stage does not have additional loads.
C. Stage no.4
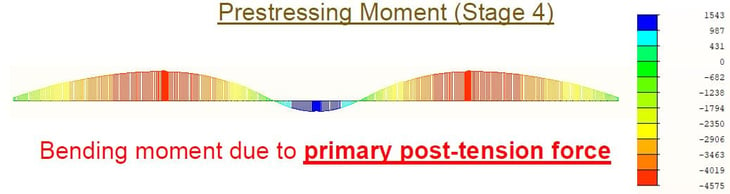
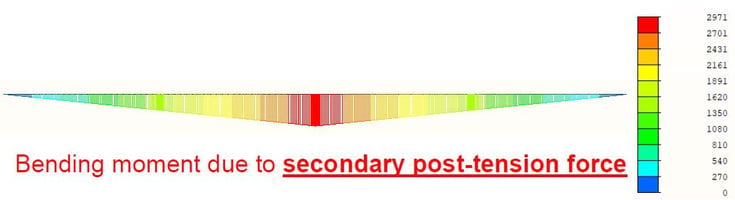
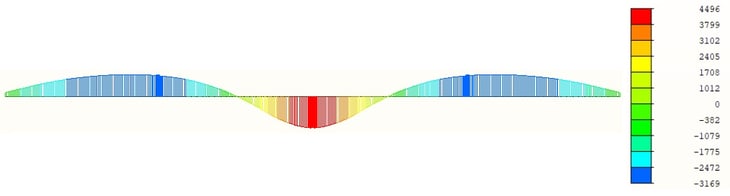
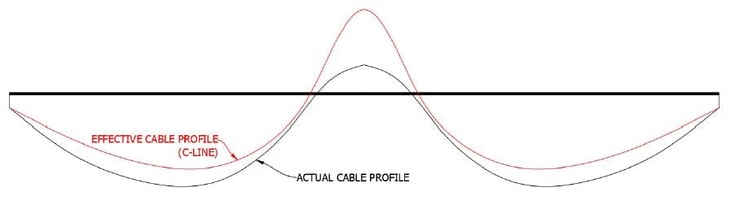
From stage no.4, we can get the bending moment diagram due to the post-tensioning force. A statically determinate structure has only internal forces due to the prestressing force called the 'Primary force.' However, statically indeterminate structures, like continuous beams, have additional internal forces called 'Secondary forces.' Secondary forces can decrease the effect of tendon forces. Therefore, the effective tendon profile considering the secondary force is considered.
D. Post-Stage
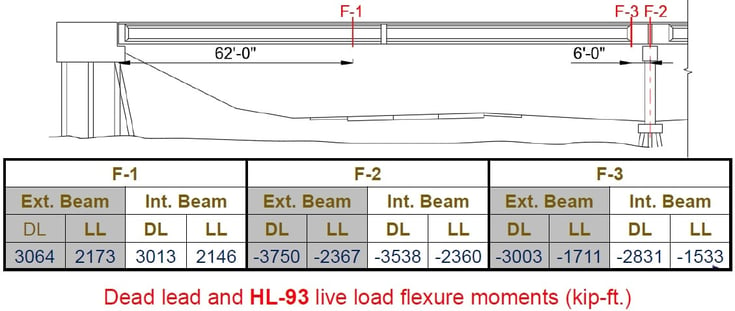
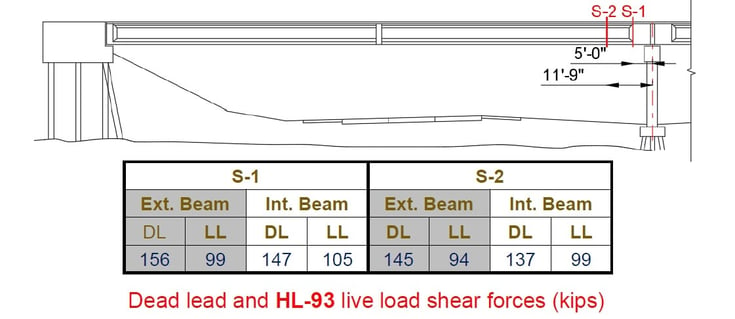
Internal forces were extracted to check the flexure strength and shear strength for the load rating. The flexure forces were extracted from three girder sections. In order to check the flexure strength against the positive bending moment, a section near the middle of the span was selected. After that, two sections near the middle of the bridge were selected to check the flexure strength against the negative bending moment. Each section has an I-shape and a solid shape. Furthermore, the maximum shear forces occur at the middle of the bridge, so two sections were selected, with each section having different shapes.
4. Load rating and in-house calculation and results from midas Civil
Load rating was conducted via two ways: In-house calculation and using a function tool in midas Civil.
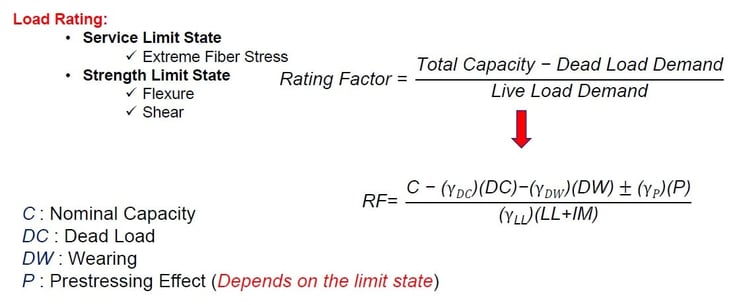
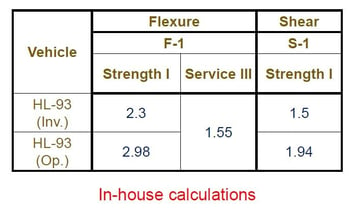
For Load rating, we have a service limit state and strength limit state. Each limit state has items that should be analyzed. Load rating was conducted using the formula as shown in figure 22. On the other hand, the rating factor can be obtained from the ratio of 'reduced capacity due to dead load' to 'live load demand.' The rating factor was calculated for sections F-1, F-2, F-3, S-1, and S-2. Figure 23 shows the results of the In-house calculations.
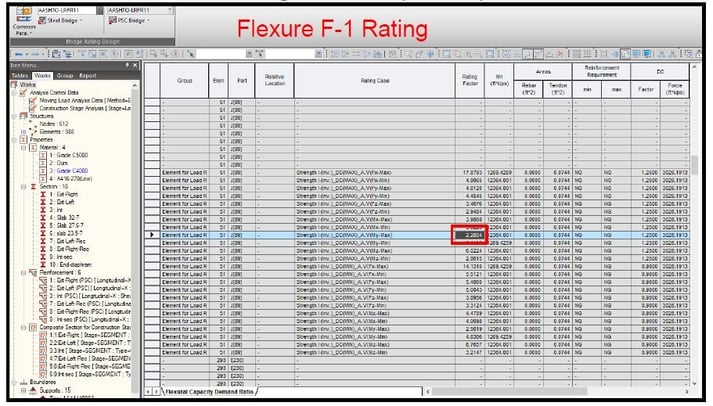
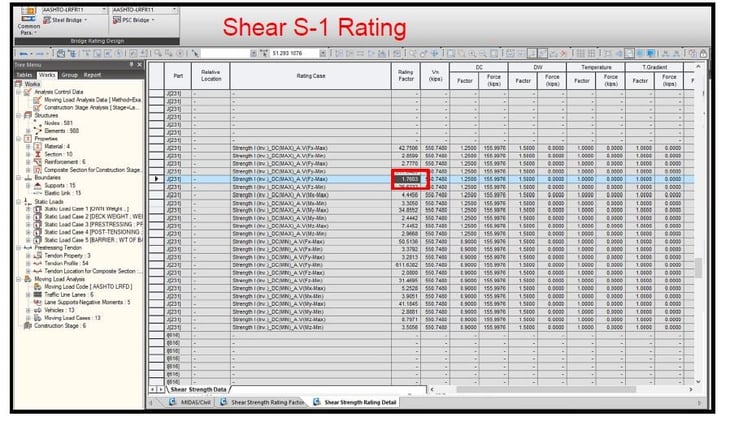
Midas Civil provides design modules that calculate the capacity of a section for PSC. Furthermore, it also provides the load rating module for AASHTO LRFR11, AASHTO LRFR15, and CS454/19. Through both modules, the rating factor was calculated. The rating factor considering HL-93(Inv.) for the flexure at the F-1 section is approximately 2.28, and the rating factor for the shear is 1.76. The results showed a slight difference in the value for the flexure/strength I. Moreover, it showed a significant difference value for the shear/strength I.
Q&A
Question 1
At what stage is the pour closure (rectangular section) over the middle pier cast? Was it a precast as well? Section F2 has pre-tensioning tendons. How were these tendons made continuous from the precast I-beams? Please clarify.
Answer 1
All the closure pours were cast with the bridge deck. The pre-tensioned strands are not continuous. They were designed to mainly carry the dead loads and other loads during construction as simply supported beams over the piers and temporary supports.
Question 2
Were pre-tensioned cables included in the flexural capacity calculation?
If yes, was the effect of PT cable included on the strands while calculating flexural capacity?
Answer 2
Yes, the contribution of pretension strands was considered in flexural strength calculation.
Question 3
Was the load rating done at the Service or Ultimate limit state? When doing the load rating for the ultimate limit state, how were the Mdl and MLL used took into account the construction stages?
Answer 3
The load rating was conducted for both ultimate (strength limit state) and service stages (Service III limit state). For the ultimate limit state, both dead and live load are acting on the continuous beam.
Question 4
What is the difference between primary and secondary losses such as tendon loss and creep and shrinkage loss?
Answer 4
The primary prestressing moment is due to the strands' physical eccentricity. The secondary prestressing moment is due to indeterminacy, so the C-line (pressure line) is different from the physical strand profile. Both moments were taking into consideration while estimating the tendon losses.
Question 5
Was there any issue with AASHTO’s Service stress checks at the middle span while having top tendons continuous without debonding at areas where they are not needed?
Answer 5
At mid-span, the top strands either do not exist (at the closure pour) or were not developed, so their contribution was not effective.