Please fill out the Download Section below the Comment Section to download the 80 Masterworks of CIVIL Engineering.
1. Introduction
Seismic analysis is needed for the estimation of structural response in the process of designing earthquake-resistant structures as well as to check the vulnerability of the existing structures to seismic waves.
2. Seismic Analysis Methods
The Seismic analysis of the bridges shall be carried out using the following methods as per applicability depending upon the complexity of the structure and the input ground motion.
- Elastic Seismic Acceleration Method (Seismic Coefficient Method)
- Elastic Response Spectrum Method
- Time History Method
2.1 Seismic Coefficient Method
For most of the structures of low to medium heights with small spans and small lengths of the bridge, the elastic seismic acceleration method (Seismic coefficient method) is adequate. In this method, structure is analyzed by its fundamental(single) mode of vibration.
2.2 Response Spectrum Analysis
This is a general method, suitable for more complex structural systems (e.g. continuous bridges, bridges with large differences in pier heights, bridges which are curved in plan, etc), in which dynamic analysis of the structure is performed to obtain the first as well as higher modes of vibration.
2.3 Time-History Method
In bridges where the pier height is high, the bridge has abrupt or unusual changes in mass, stiffness, or geometry along its span and has large differences in these parameters between adjacent supports, special seismic devices such as dampers, isolator shock transmission units, etc. are provided and where the large spatial variation need to consider than time history method should be used.
The dynamic analysis of a bridge by time history method may be carried out using the direct step-by-step method of integration of equations of motion suitable steps small enough to include the response of the highest modes of vibration. This method is also recommended in situations where a large number of modes of vibration are expected to participate in bridge response.
3. Response Spectrum Analysis
It is a representation of the maximum response of idealized single-degree-of-freedom systems of different periods for a fixed value of damping, during an earthquake.
The maximum response is plotted against the undamped natural period and for various damping values and can be expressed in terms of maximum absolute acceleration, maximum relative velocity, or maximum relative displacement.
4. Factors Affecting Response Spectrum Analysis
Seismic analysis is a tool for the estimation of structural response in the process of designing earthquake-resistant structures and/or retrofitting vulnerable existing structures.
- Magnitude
- Source Mechanism and Characteristics
- Distance from the source of energy release
- Wave travel Path
- Rupture Directivity
- Local geology and site conditions
5. Free Vibration Analysis
The dynamic properties (natural periods, and mode shapes) for vibration in the X-direction have been obtained by carrying out a free vibration analysis. While performing the eigenvalue analysis we assume that the mass distribution is taking place with the beam completely constraining the column as per the required stiffness as shown in Fig. 1.
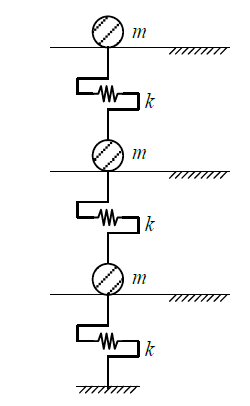 Figure 1. Mass Distribution Concept for Eigenvalue Analysis
The mass and lateral stiffness of each layer are obtained according to the given conditions.
Flexural stiffness of each layer,
k = 2*(12EI/L^3)
The mass and stiffness matrices for the eigenvalue analysis are as follows.
Mű + ku = 0
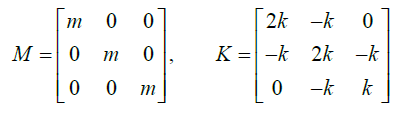
Since the eigenvalue analysis corresponds to the free vibration analysis, the determinant must be zero.

Where,
Wn = k / m
The above equation is a cubic equation for eigenvalue, and the eigenvalue obtained through the solution of a cubic equation is consistent with the analysis result by CIVIL.
6. Procedure for Response Spectrum Analysis using MIDAS CIVIL
The procedure for response spectrum analysis in MIDAS CIVIL is outlined below.
1. Specify the mass data using various ways provided in the Main Menu, Model > Masses.
For converting the self-weight into mass when assigned as Self Weight option, use Structure > Convert Self Weight into Masses
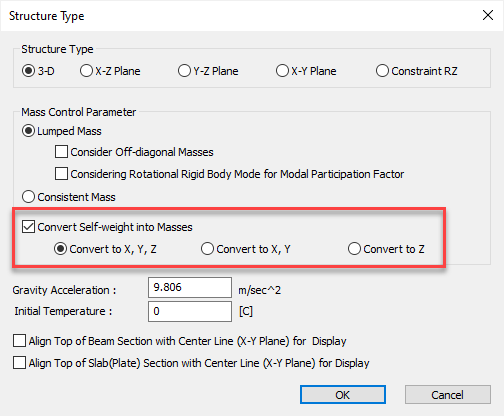
Figure 2. Mass Distribution Concept for Eigenvalue Analysis -1
2. Enter the number of modes and necessary data for eigenvalue analysis in "Eigenvalue Analysis Control".
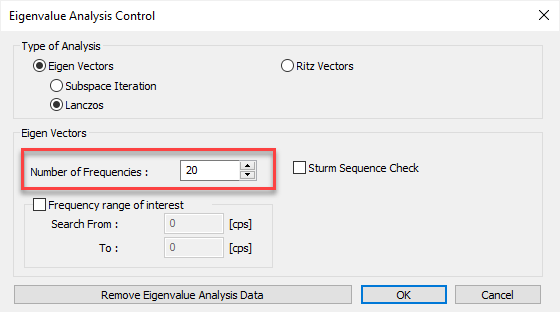 Figure 3. Mass Distribution Concept for Eigenvalue Analysis -2
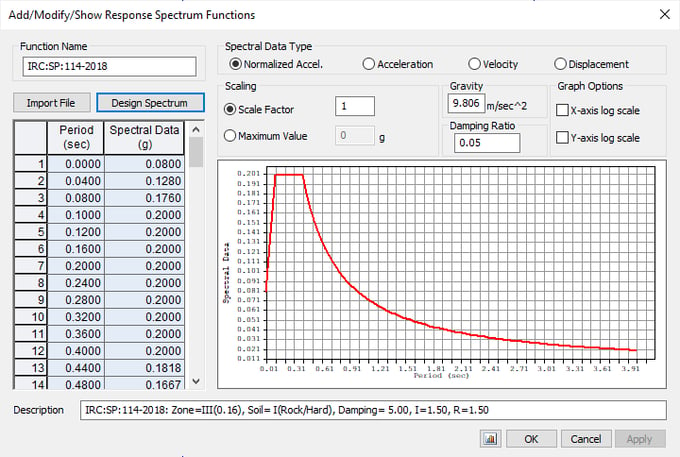
3. Define spectrum data to be applied in "Response Spectrum Functions".
4. Set options related to response spectrum analysis in "Response Spectrum Load Cases".
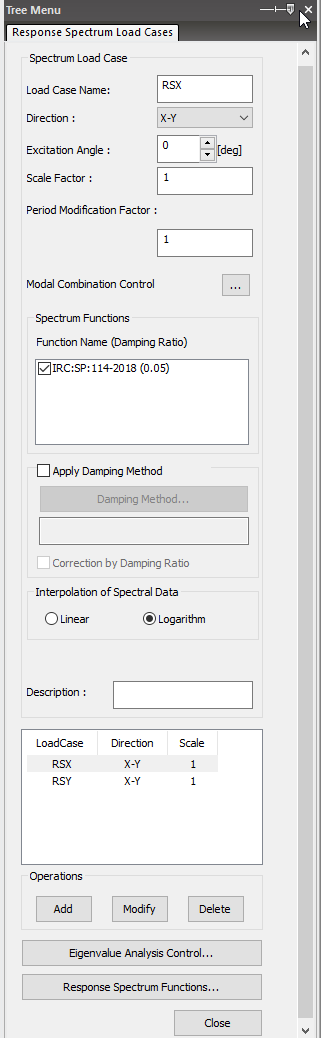 Figure 5. Mass Distribution Concept for Eigenvalue Analysis -4
5. Perform analysis by clicking

6. When an analysis is completed, analyze the results using load cases or load combinations with various post-processing functions from the Results menu.
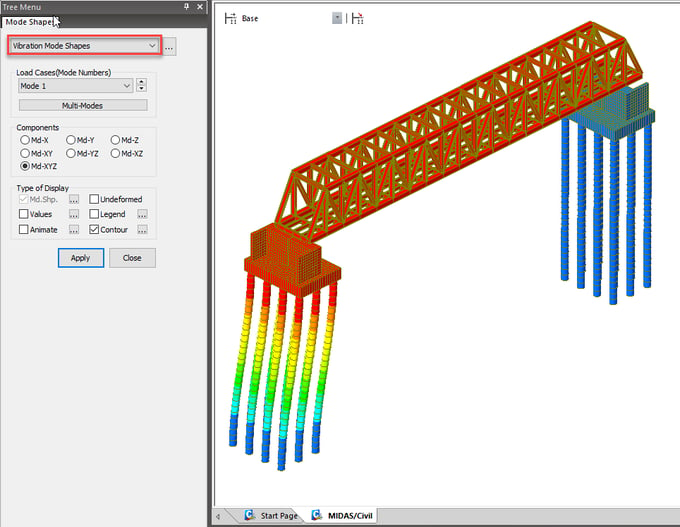
Figure 6. Mass Distribution Concept for Eigenvalue Analysis -5
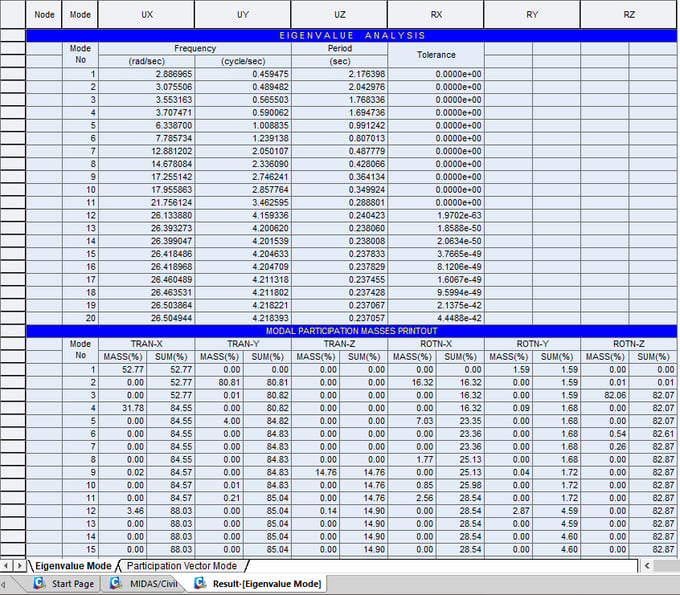
7. Verification of Spectral Data
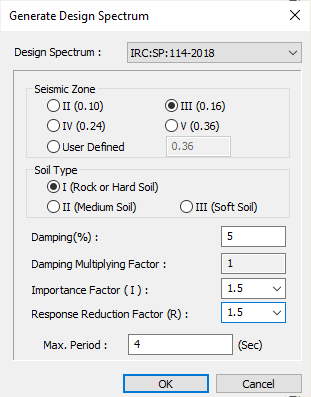
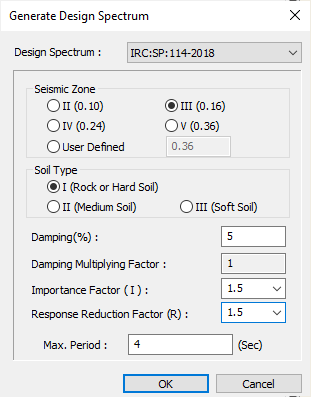
Let us take the example of Response Spectrum data as per IRC SP 114:2018 using MIDAS CIVIL. The following data is considered for generating the Response Spectrum Function in MIDAS CIVIL.
Input Data
Design Spectrum Code IRC SP 114-2018
Seismic Zone III
Zone Factor (Z) 0.16
Soil Type I (Rock or Hard Soil)
Damping (%) 5
Damping Multiplying Factor 1
Importance Factor (I) 1.5
Response Reduction factor (R) 1.5
Max Period (t) (sec) 4
In MIDAS CIVIL, Enter spectral data for response spectrum analysis. Response Spectrum Analysis calculates modal responses using the natural periods obtained by Eigenvalue analysis. Therefore, the Response Spectrum Function must be defined, which includes the range of the considered natural periods obtained from the Eigenvalue analysis as shown in Fig.8 and Fig.9.
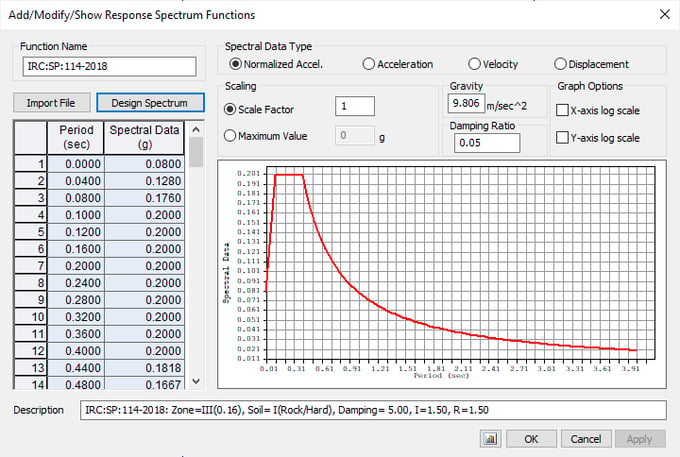
Design acceleration coefficient for different soil types, normalized with peak ground acceleration Sa/g will be calculated based on the soil type and period as shown in fig. 10.
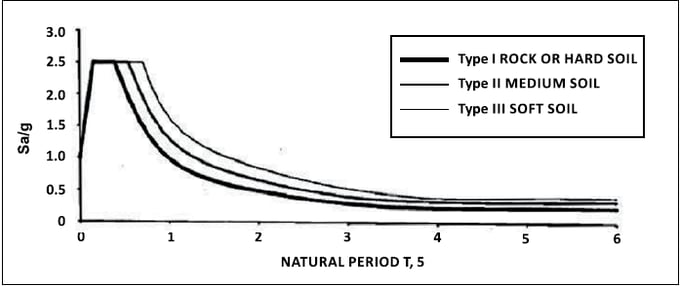
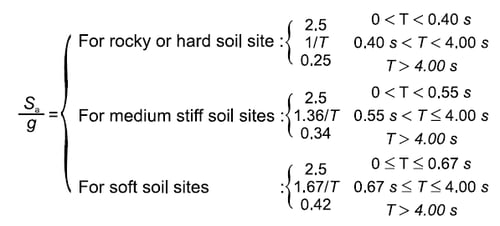
The function is plotted for period vs design horizontal seismic coefficient as shown in Table 1.
The seismic force to be resisted by bridge components shall be computed as follows:
Fh = Ah x (Dead load +Appropriate live load)
Where,
Fh = horizontal seismic force to be resisted.
Ah = design horizontal seismic coefficient
The design horizontal seismic coefficient shall be determined as follows:
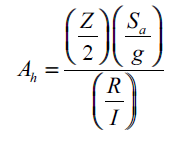
The manual calculation is made for the period with intervals of 0.001 sec to 0.03 sec. Similarly, we need to calculate the Sa/g and corresponding Ah value for the required time period. Table 1 gives the Horizontal Seismic coefficients for different Period Values.
For example, T = 0 sec, Sa/g = 2.5,
Ah = (Z/2) x (Sa/g) x (I/R) = (0.16/2) x (2.5) x (1.5/1.5)
|
Period (sec) |
Sa/g |
Ah |
|
0 |
1.0000 |
0.0800 |
|
0.001 |
1.0150 |
0.0812 |
|
0.002 |
1.0300 |
0.0824 |
|
0.003 |
1.0450 |
0.0836 |
|
0.004 |
1.0600 |
0.0848 |
|
0.005 |
1.0750 |
0.0860 |
|
0.006 |
1.0900 |
0.0872 |
|
0.007 |
1.1050 |
0.0884 |
|
0.008 |
1.1200 |
0.0896 |
|
0.009 |
1.1350 |
0.0908 |
|
0.01 |
1.1500 |
0.0920 |
|
0.011 |
1.1650 |
0.0932 |
|
0.012 |
1.1800 |
0.0944 |
|
0.013 |
1.1950 |
0.0956 |
|
0.014 |
1.2100 |
0.0968 |
|
0.015 |
1.2250 |
0.0980 |
|
0.016 |
1.2400 |
0.0992 |
|
0.017 |
1.2550 |
0.1004 |
|
0.018 |
1.2700 |
0.1016 |
|
0.019 |
1.2850 |
0.1028 |
|
0.02 |
1.3000 |
0.1040 |
|
0.021 |
1.3150 |
0.1052 |
|
0.022 |
1.3300 |
0.1064 |
|
0.023 |
1.3450 |
0.1076 |
|
0.024 |
1.3600 |
0.1088 |
|
0.025 |
1.3750 |
0.1100 |
|
0.026 |
1.3900 |
0.1112 |
|
0.027 |
1.4050 |
0.1124 |
|
0.028 |
1.4200 |
0.1136 |
|
0.029 |
1.4350 |
0.1148 |
|
0.03 |
1.4500 |
0.1160 |
Table 1. Period vs Seismic Coefficient
8. Summary
The Response Spectrum Analysis is used to evaluate the dynamic effect of ground motions. In this method, the base shear is calculated based on the time period, and mass participation of the structure. As an engineer, we need to check the base shear for static seismic as well as for dynamic seismic loads. The critical force will be taken for the design. There are simple analytical methods to verify the forces getting from the Response Spectrum method, though analysis programs such as MIDAS CIVIL will be used to optimize the solutions with time.
9. References
IRC: 6-2017, Standard Specifications and Code of Practice for Road Bridges, Section: II, Loads and Load Combinations (March 2017)
IRC: SP: 114-2018, Guidelines for Seismic Design of Road Bridges (May 2018)

/Photos%20of%20specialists/Pratap-1.png)