Pushover is a nonlinear static procedure that incrementally applies lateral loads to a bridge model, typically until a target displacement is reached or the structure reaches global instability. The analysis is instrumental in identifying inelastic behavior, hinge formation, redistribution of internal forces, and the progression of failure mechanisms.
1. Is Pushover Analysis Required?
Across North America, pushover analysis is explicitly required by codes and local standards for bridges in moderate to high seismic zones. These stipulations are structured to ensure inelastic behavior is evaluated and accounted for not just assumed.
Pushover analysis is required by many DOTs and mandated in seismic provisions of AASHTO LRFD and CSA S6 across several U.S. states and Canadian provinces.
1.1 United States
| 1st Requirement | Pushover analysis required as regions falling under SDC C,D and E category |
| State | California(Mandatory), Washington, Alaska |
| 2nd Requirement | Pushover analysis required for critical bridges |
| State | New Jersey, New York, Utah, Nevada, Oregon, Illinois |
1.2 Canada
| 1st Requirement | Pushover analysis required as regions falling under SPC 3 |
| Province | British Columbia |
| 2nd Requirement | Pushover analysis required for critical bridges |
| Province | Quebec, Ontario, Alberta, Saskatchewan, Manitoba |
This article covers the fundamentals of pushover analysis as applied to bridge structures including modeling strategies, interpretation of capacity curves, over-strength and ductility considerations, and practical implementation using tools like midas Civil NX.
2. Key Seismic Design Concepts for Pushover Analysis
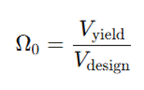
2.1 Over-strength
Concrete elements often exhibit greater capacity than what design equations reflect. This extra strength comes from nonlinear behavior and ductility not captured in code-based elastic analysis. Over-strength is essentially the system’s hidden reserve, emerging from material variability, redistribution, and conservative assumptions.
It is quantified as:
|
For each shear capacity:
|
Where:
- Vyield: Shear force when yielding initiates (actual behavior)
- Vdesign: Code-calculated elastic demand
Typical Ω0 for bridge columns: 1.2 to 1.5
Used to scale demands on: Capacity-protected members (footings, piles)
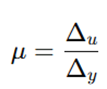
2.2 Ductility
Ductility is a structure’s ability to undergo large inelastic deformations while maintaining strength. It's critical in seismic performance, allowing structures to redistribute force without brittle failure.
Measured as:
|
For each ductility check:
|
Also used:
- Curvature ductility: ϕu/ϕy
- Rotation ductility: θu/θy
2.3 Moment–Curvature (M–φ) Relationship
Defines how a section responds under increasing bending moment. M–φ curves represent:
- Initial linear (elastic) phase
- Yield point (steel starts yielding)
- Post-yield (cracking, strain hardening, crushing)
Key parameters:ϕy Curvature at first yield
- ϕu: Curvature at failure (crushing/buckling)
- ϕp = ϕu−ϕy
- θp = ϕp×Lp (plastic rotation)
midas Civil NX and GSD module fiber models provide accurate M–φ curves accounting for real material behavior.
2.4 Plastic Hinges
Plastic hinges localize inelastic rotation post-yield. They are modeled as nonlinear rotational springs in analysis software and placed at potential yielding zones typically ends of columns or beams.
Plastic hinge length Lp = 0.08 * L+ 0.022 fy * db * Lp
Plastic hinges properties depends on:
|
Where:
- L: Column clear height
- fy : Yield strength in ksi
- db: Bar diameter in inches
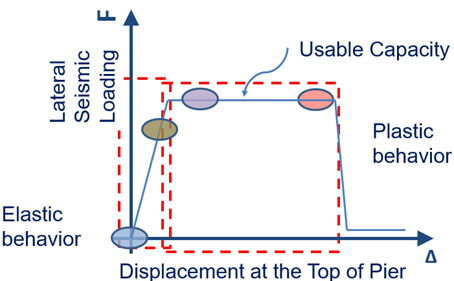
3. Understanding the Pushover Curve
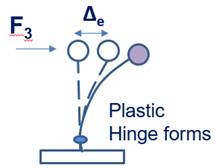
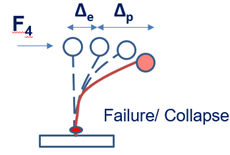
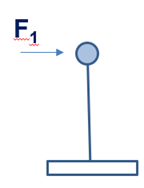
The pushover curve illustrates how a structure responds to increasing lateral loads, simulating seismic demand in a controlled, stepwise manner. It starts with an idealized SDOF system, representing the structure's dominant mode. Gravity loads are present from the beginning, and lateral forces are incrementally applied to evaluate stiffness, yield, and deformation capacity.
Pushover Curve
|
Stage 1 |
Stage 2 |
Stage 3 |
Stage 4 |
|
|
 |
 |
 |
|
|
|
|
4. Modeling in midas Civil NX
In midas Civil NX, pushover analysis does not require starting over. If you're working on a seismic bridge project and have already completed a construction stage model or a final strength-stage model, you can run pushover directly no duplicate geometry, no fresh meshing, no resetting boundary conditions.
4.1 Starting Point: Use Your Existing Model
Pushover analysis in midas Civil NX begins with your final bridge model whether it includes time-dependent effects, staged loading, or not.
- Soil springs can be preserved, which is especially important if pier behavior is governed by foundation flexibility or ground interaction.
- Superstructure can be included or excluded depending on what governs the failure mechanism.
- If pier-superstructure interaction is important (e.g., integral bent), keep the entire bridge.
- If you’re only checking substructure capacity, keep just the piers and apply gravity from the superstructure as a static load.
- Construction-stage dead loads can be retained as-is or collapsed into simplified loads.
This flexibility means there is no rework in defining structural elements, loading, or boundaries.
Elastic Stiffness Already Exists / Nonlinear Behavior Is What’s Missing
Your model already captures global elastic stiffness: member sizes, stiffness modifiers, support conditions, spring behavior, and time-dependent effects (if any) are in place.
What’s missing is how the sections behave after yielding, which is where the nonlinear hinge definitions come in.
4.2 Defining Nonlinear Section Behavior Using GSD
In GSD, the engineer recreates the actual cross-section:
- Geometry and reinforcement layout (longitudinal and transverse)
- Material properties: concrete strength (f′c), steel yield strength (fy)
- Confinement zones (for ductility enhancement)
- Plastic hinge length (Lp), either input manually or determined automatically based on established empirical formulas (e.g., from Paulay and Priestleyor code provisions (e.g., ACI, EC8), considering section dimensions and material properties.
- Applied axial load, which is crucial as it significantly influences the moment-curvature relationship, moment capacity, and ductility of the section, particularly for columns and piers. High axial compression, for instance, can reduce sectional ductility.
GSD performs a moment–curvature (M–ϕ) analysis, capturing:
- Elastic response
- Concrete cracking
- Steel yielding
- Post-yield hardening (due to confinement and strain hardening of steel)
- Ultimate curvature at failure (e.g., concrete crushing, steel rupture)
The resulting M–ϕ curve reflects how the section will behave when it reaches its yield threshold. This behavior accounts for overstrength, ductility, and confinement effects based on actual detailing.
4.3 From Sectional Behavior to Structural Hinge
The continuous M–ϕ curve is converted into a backbone curve a bilinear or trilinear approximation that can be assigned in midas Civil NX. This approximation typically defines key limit states such as concrete cracking, steel yielding, and ultimate capacity (e.g., concrete crushing or steel fracture), consistent with FEMA and other performance-based design frameworks.
Each hinge now includes:
- Elastic stiffness
- Yield point
- Post-yield slope (hardening or softening)
- Ultimate curvature (rotation limit)
It also maps to performance levels such as:
- Immediate Occupancy (IO)
- Life Safety (LS)
- Collapse Prevention (CP)

This backbone hinge, derived from actual section properties, is what the program uses to simulate nonlinear behavior during pushover. It replaces generic assumptions with true section-based capacity.
Once created, the hinge can be assigned at any location expected to yield:
- Bottom of piers
- Bent cap ends
- Haunches
- Interface zones in integral bridges
This flexibility ensures that all potential plastic regions in the bridge model can be defined with engineer-controlled nonlinear behavior.
4.4 Running the Pushover Analysis in midas Civil NX
With hinges in place, the analysis proceeds by applying lateral load or displacement:
- Force-Controlled: Lateral load is increased incrementally. This is suitable for stiffness-degrading systems where the ultimate capacity is clearly defined by a peak.
- Displacement-Controlled: A target displacement (usually at the pier or deck) is applied in steps. This method is generally preferred for ductile structures where significant softening may occur post-peak, allowing the full force-displacement response to be captured.
You can define the expected failure mode or apply the structure’s first mode shape as the lateral load pattern.
P–Delta effects (both global P-Δ from axial loads and story drift, and local p-δ from member curvature) can be included. midas Civil NX updates internal forces and hinge states at each step, tracking convergence and stiffness degradation.
4.5 Interpreting the Pushover Results
Pushover Curve
midas Civil NX generates the base shear vs. control point displacement curve. This shows:
- Initial elastic stiffness
- Yield point
- Post-yield progression (including any hardening or softening)
- Residual strength
- Ultimate displacement capacity
This curve forms the basis of performance evaluation and ductility checks.
Key Quantities Extracted
- Yield Displacement (Dy) and Ultimate Displacement (Du)
- Displacement Ductility (μD=Du/Dy)
- Plastic rotation (θp) and curvature (ϕp) at each hinge location (providing insight into rotational and curvature ductility).
- Hinge state progression:
- Elastic → Yield → Post-yield → Failure
- FEMA performance stages: A–B, IO, LS, CP
Hinge Status Output
midas Civil NX plots and tabulates hinge status at each increment, showing when and where yielding occurs and whether any hinge exceeds Life Safety or Collapse Prevention limits. This visual and tabular output is crucial for identifying critical regions and potential failure mechanisms.

Node Displacement and Drift Profiles
You can extract displacement at any node (e.g., pier top or deck) and compute drift ratios for slender piers, which are critical for assessing stability and serviceability.
Residual Capacity
If the structure softens post-peak, midas Civil NX captures this directly, showing strength loss and convergence termination. This allows engineers to understand the post-ultimate behavior and reserve capacity, if any.
Performance Point and Capacity–Demand Comparison
Using the ADRS (Acceleration-Displacement Response Spectrum) method, midas Civil NX overlays the pushover curve (converted to an equivalent SDOF system) with:
- Elastic demand spectrum
- Site-specific spectral data (FEMA, EC8, or user-defined), often modified by effective damping to account for inelastic energy dissipation.
This identifies the performance point, where the structure’s capacity meets seismic demand, indicating the expected inelastic response under the design earthquake.
From here, you can evaluate the bridge’s performance level:
|
Evaluation |
Check |
|
Capacity ≥ Demand (Δc≥Δd) |
Acceptable design |
|
μD within required range |
Meets CSA/AASHTO performance levels (e.g., minimum displacement ductility requirements) |
|
Plastic rotations within limits |
Achieves Life Safety or better for critical components |
|
Capacity falls below target or fails to converge |
Redesign required (indicates insufficient capacity or ductility for the specified demand) |
Final Outcome
With GSD on midas Civil NX, pushover analysis becomes a direct extension of your design model:
- Elastic stiffness stays unchanged.
- Nonlinear hinge behavior is based on actual section analysis, accounting for detailed geometry, reinforcement, and material properties.
- Structural failure is simulated using real ductility and strength data, derived directly from the sectional moment-curvature response.
- Performance evaluation follows national and international code limits and established performance-based design criteria.
This lets engineers move from elastic response spectrum checks to full nonlinear capacity evaluation without remodelling or approximating and with full control over hinge behavior at every step.
Frequently Asked Questions (FAQs)
1. Is pushover analysis mandatory for all bridges in seismic zones?
Not for all, but it is explicitly required by code in several cases:
- AASHTO LRFD (2020): Pushover (or equivalent inelastic analysis) is required for Seismic Design Categories C and D, as per Table 1.3–10 and Article 5.4.2.
- CSA S6:19 Clause 4.4.5.2.1: Mandates pushover for “Major Route” bridges under Performance-Based Design.
- Provincial supplements like BC MoTT (2025) also require pushover to identify yield and collapse mechanisms for moderate to high seismic zones.
2. How do I determine the correct hinge length and rotational limits?
Refer to:
- AASHTO Article 5.5.2: Hinge length ≥ L/6 or 0.5D, whichever is greater.
- Caltrans SDC Table 4.3-1: Plastic rotation limits are:
- ≤ 0.02 rad (Type I)
- ≤ 0.04 rad (Type II)
- CSA Clause 6.14: Specifies acceptable rotational capacities based on confinement and axial load.
Hinge lengths and limits must be validated against these clauses using moment-curvature analysis.
3. What is the acceptable displacement ductility (μD) for seismic piers?
- Per Caltrans Section 4.3.5, ductility ratio μD must be ≤ 4 for typical reinforced concrete columns.
- CSA S6:19 Clause 6.14.4 and AASHTO Commentary C5.5 recommend similar checks based on curvature demands and hinge rotation.
- Ensure μD = Δu / Δy is calculated at the performance point using pushover curve outputs.
4. Does midas Civil NX perform pushover analysis with soil-structure interaction (SSI)?
Yes, midas Civil NX can perform this and the codes require it:
- Caltrans SDC Section 3.1: Requires SSI modeling using nonlinear p-y, t-z, and q-z springs.
- CSA Clause 4.4.3.3: Includes foundation-soil flexibility within the inelastic demand assessment.
- midas Civil NX supports nonlinear SSI modeling, allowing foundation behavior to be captured directly in the pushover procedure.
5. What documentation must be submitted for code-compliant pushover analysis?
The following are readily available in midas Civil NX with GSD module:
- Pushover curves (Base Shear vs. Displacement)
- ADRS plots showing performance point (per AASHTO 5.4.3 or CSA S6:19 Clause 4.4.5)
- Plastic hinge diagrams and damage state progression
- Tables showing μD, θp, and capacity vs. demand