Importance of Accurately Modeling Substructures
Table of Contents
1. Introduction
2. Different Methods of Modeling for Bridge Substructure Forces
3. Modeling a Straight Box Girder Bridge
4. Comparative Result Interpretation
5. Summary
1. Introduction
Bridges generally end up being complex geometries owing to various reasons like highway alignment criteria, adjoining structures, aesthetic requirements, and so on. Often, engineers from different teams would be working on different stretches of the bridges. There may even be a separate team of engineers working on the superstructure and substructure of the bridge. Sometimes, the structural finite element models for different parts of the bridges are modeled and analyzed separately to simplify the analysis process and for quicker final design delivery. This is an acceptable approach for structural analysis. However, in complex structures, such approximations can lead to considerable variations in the forces compared to the forces practically induced in the structure. This article will see how these approximations can affect the final design forces and what approximations shouldn’t be acceptable.
2. Different Methods of Modeling for Bridge Substructure Forces
Method 1: Model fixed support below the superstructure and apply the reactions obtained as forces for the substructure. This is a very simplified method and is usually suitable for straight bridges. This is especially helpful when multiple teams are working on the same bridge structure. A significant drawback of this system is that it does not consider force redistribution due to superstructure-substructure interaction. This is quite an old approach and isn’t recommended today, with such advancement in computational systems. Moreover, the concurrent forces would have to be carefully obtained for proper application in substructure modeling. There are significant chances of mistakes in such modeling for the final design. 3D view of superstructure to obtain forces with such modeling is shown in figure 1.

Method 2: Model the structure up to the base of the pier and provide fixed support at the base of the pier. The reaction obtained at the pier base is applied at pile cap level in a separate model. This approach imparts certain flexibility to the structure compared to the approach stated in method 1, leading to a better estimate of forces in the structure. This approach is generally preferred for preliminary design when actual soil data isn’t readily available. 3D view of modeling by this method is shown in figure 2.
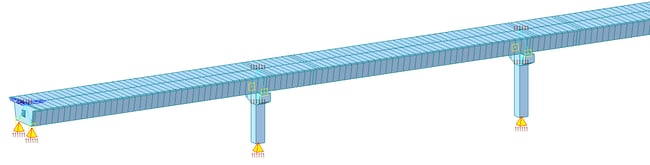 Figure 2. Bridge model with piers & pier caps having fixed support at base of piers
Method 3: Model the structure up to the base of the pier and provide a general spring at the base of the pier, representing the foundation stiffness. This method provides a better force estimate for the structure. However, a separate model is still required for the pile and pile cap modeling, analysis & design. This approach is generally followed by engineers to accurately analyze structure above the foundation and reduce the overall computation and modeling time for the foundation that may have multiple elements, like long piles. The 3D view of the model generated by methods 2 and 3 will be the same. The only difference would be the springs at the pier base, as shown in figure 3.
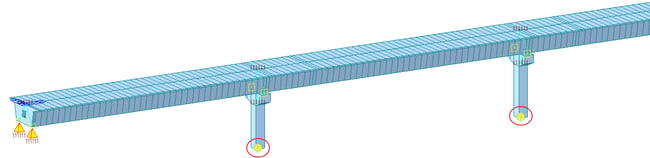 Figure 3. Bridge model with piers & pier caps having point spring supports at base of piers
Method 4: Model the complete structure, including foundation elements like piles and pile caps, and consider soil stiffness employing p-y curves. This method may show minor improvement over the forces as obtained in method 3. This method is generally preferred when the structural design is being finalized as it involves the least approximations. 3D view of such modeling is shown in figure 4. For clarity purposes, the pile springs generated to represent the p-y curve are not being displayed. These are applied at all the nodes in piles along its length. This method gives a very good estimate of design forces considering the superstructure-substructure interaction.
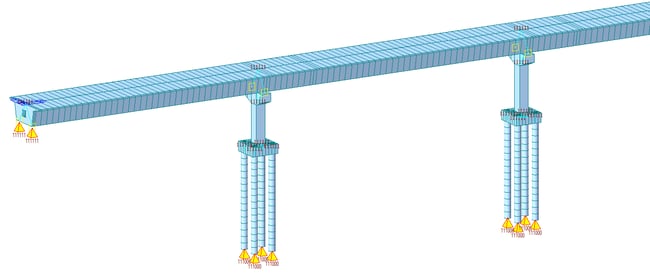 Figure 4. Bridge model with complete substructure
Method 5: Model the complete structure as well as adjoining soil to verify the soil-structure interaction. Non-linear material models are used to define the soil properties. Generally, this approach is followed to check whether the assumptions for calculating the soil stiffness are acceptable or not in peculiar situations. This method is seldom done for the complete structure. If the results from this model are deviating significantly from the forces obtained in method 4, then the soil spring stiffness may need to be updated, and the structure is redesigned.
In the following sections, we’ll compare and see how bending moment, shear force, and deformation in structure vary due to different modeling methods for substructure. For this, we’ll not consider method five since that method has more to do with non-linearity in soil rather than structural flexibility.
3. Modeling a Straight Box Girder Bridge
For the sake of this study, a 3-span (40m – 45m – 40m) continuous straight PSC box girder bridge is considered. One of the piers is longer than the other pier by 1.25m. The pile and pile cap configuration are the same for both the piers. Construction stages are as follows:
Stage 1 – Substructure is activated. This is different for different methods.
- Method 1 – Support nodes and bearings
- Method 2 – Pier, pier cap, and bearings
- Method 3 – Pier, pier cap, and bearings
- Method 4 – Piles, pile cap, pier, pier cap, and bearings (Figure 5)
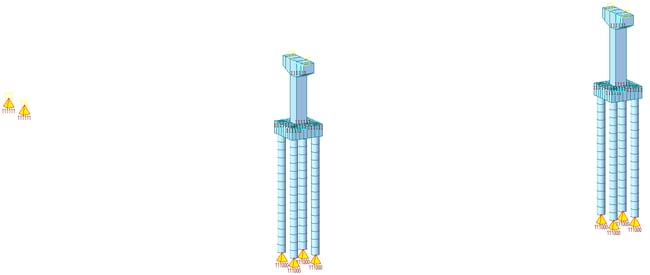 Figure 5. Stage 1, substructure construction - Method 4
Practically, pile, pile cap, pier, and pier cap aren’t cast at one go. Still, if all these elements are activated in the same stage for a structural model, that is an acceptable approximation for such a structure.
Stage 2 – Superstructure is activated for span 1, up to the construction joint in span 2 (Figure 6).
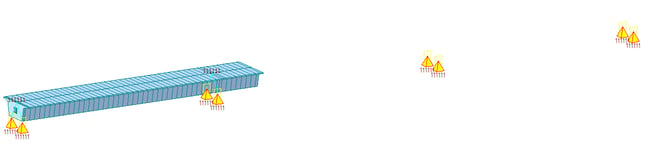 Figure 6. Stage 2, first span construction - Method 1
Stage 3 – Superstructure is activated for span 2, up to the construction joint in span 3 (Figure 7).
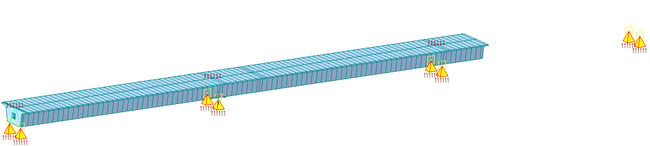 Figure 7. Stage 3, second span construction - Method 1
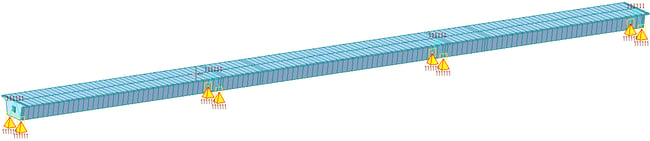
Stage 4 – Superstructure is activated for the final span (Figure 8).
Stage 5 – Long term effects up to 30 years
4. Comparative Result Interpretation
With these as stages, the models are analyzed, and a few of the results that we would be checking are shown in Figure 9.

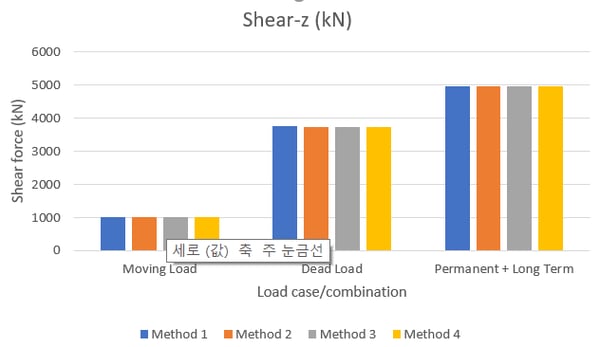
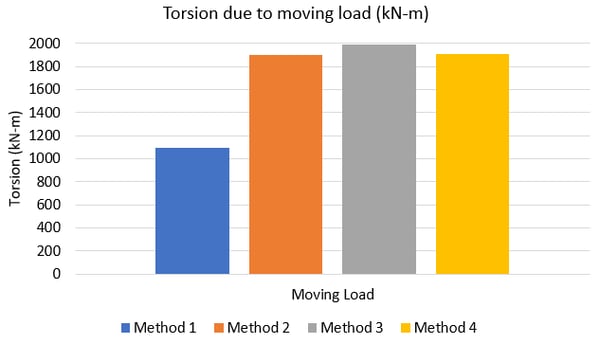
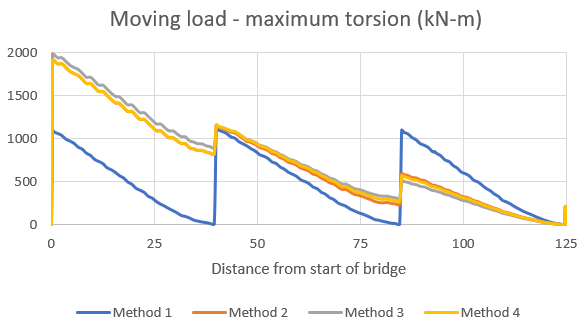
Torsion is just considered from moving loads, as it is a major contributor for torsion in straight bridges. As it could be interpreted from the charts above, the bending and shear results in the superstructure are comparable for all four modeling methods. However, the torsional demand is greatly underestimated in the model generated with method 1. With method 1, the torsion of each span is restricted between the supports. However, with other modeling methods, this torsional effect is distributed in the spans leading to higher torsional forces. Such forces would be practically expected. This would affect the forces in the bearings as well as the final forces for pier design. An estimate of this variation is shown in figure 10 below.

The maximum compressive force in the bearing is overestimated at 5%, while the minimum bearing force is overestimated by about 24%. Moreover, for the design of the superstructure, there is a check for combined shear and torsion. This check would be grossly incorrect if the bearing stiffness and substructure stiffness are not considered to obtain the final design forces.
4. Summary
-
For a straight structure, method 2, i.e., bridge structure modeling up to the base of the pier, provides a quick and accurate estimate for the force distribution in the structure.
-
The major discrepancy is noted in the torsional force estimate by method 1 as compared to other methods.
-
For a curved structure, which is subjected to higher torsional forces, this discrepancy will further increase. A detailed substructure model, preferably as recommended in method 4 should be generated.
-
A superstructure section that may satisfy combined shear and torsion check when forces are taken with method 1, may fail when forces are taken with another, more practical modeling approach.
-
Bearing forces and hence bearing sizes can vary and method 1 gives very conservative forces compared to other methods.